General Brand Analytics, Brand Health Status and Performance Analytics
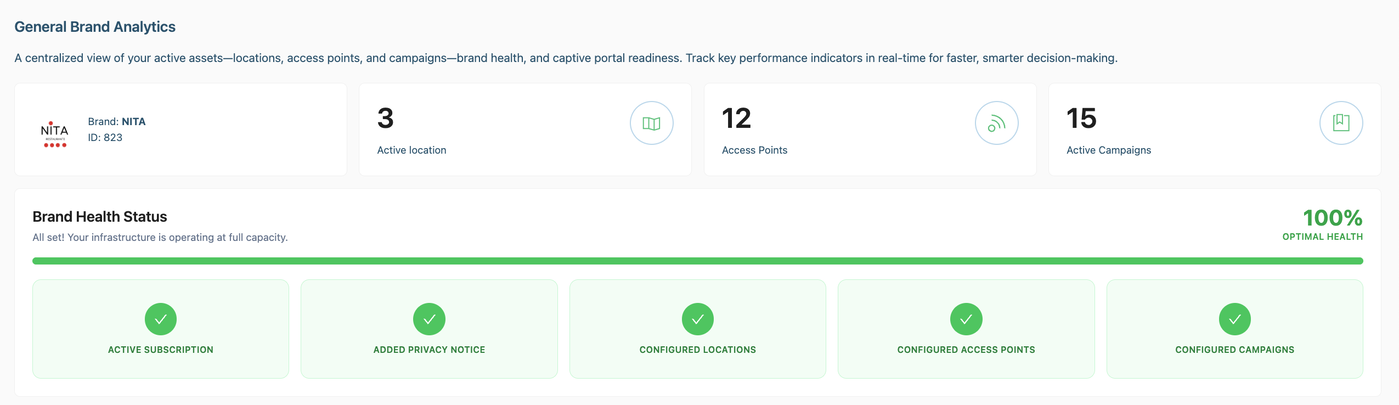
General Brand Analytics
A centralized view of your active assets, locations, access points and campaigns. Track key performance indicators in real-time for faster, smarter decision-making.
Brand Health Status
Real time status of your brand and its captive portal configuration steps. Track how well your brand is set up for the best guest experience.
Active subscription.- Here you can see the status of your subscription by the check mark at left side of the title.
Added Privacy Notice.- The Privacy Notice is mandatory under certain laws, be sure to include your company or the person responsible for the data captured through Aiwifi to protect yourself and your users. Once the Privacy Notice is added the check mark icon will be active at left side of the title.
Configured Locations: The location is where your business is located. Once you configure your location details (the locations name , external Id, locations address, the maximum location capacity and the locations language a check mark will be shown at left side of the title.
Configured Access Points.- Add the details of your Access points like the location, the name to identify it, select the brand and the Mac Address. Once you do it, a check mark icon will be shown at the left side of the title.
Configured Campaigns.- Here you can see if you have already configurate an created campaigns on your captive portal.Now you can filter analytics obtained by locations, tags and periods of campaigns.
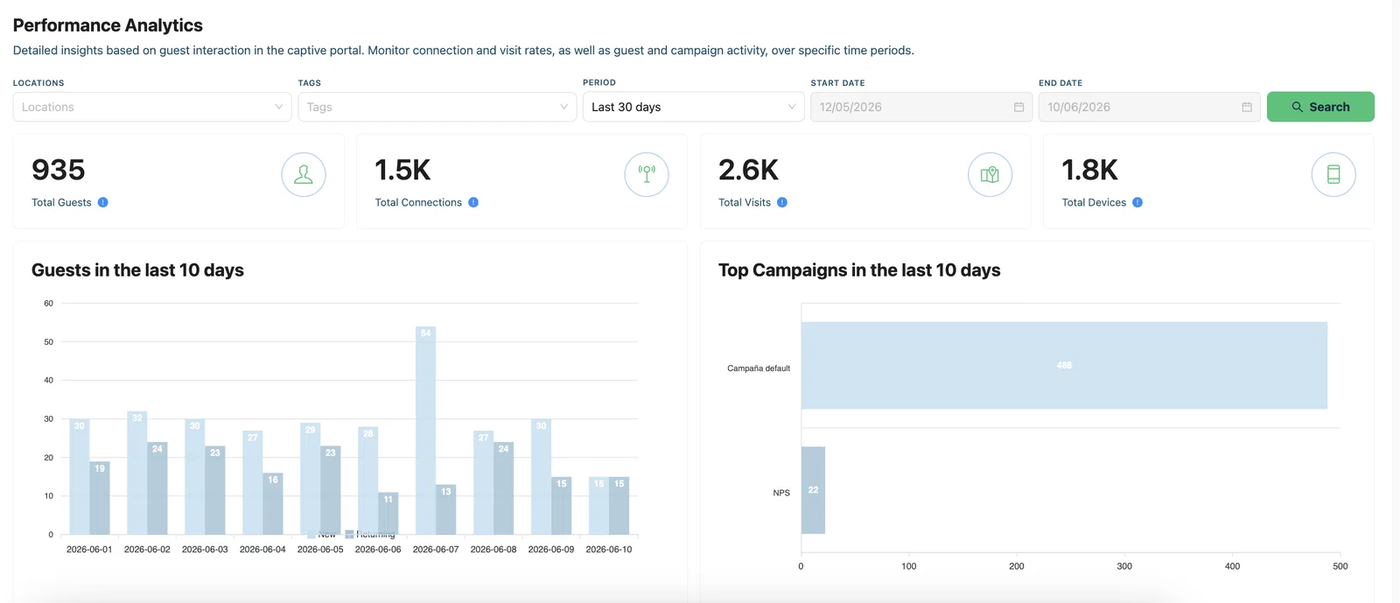
Performance Analytics
Detailed insights based on guest interaction in the captive portal, monitor connections and visit rates as well as guest and campaign activity, over specific time periods.
Location: Press the button on the right side to deploy the locations, choose the locations you want to filter.
Tags: If you have tags created already on your platform, press the button at the right side to deploy the tags, choose the campaign tag you want to see the insights obtained.
Period: Press the button at right side to deploy the periods: Past week, This month, Last month, Last seven days, Last 14, Last 30 days, Last 90 days, Custom.
Start Date: Press the right button to deploy the calendar, then choose the start date.
End Date: Press the right button to deploy the calendar, then choose the end date.
Once you selected the location, brands and time period, press the button “Search”.
Guests in the last 30 days.- The graphic shows the new and returning guests in the last 30 days.
Top Campaigns in the last 30 days.- The graphic shows the top campaigns that received more connections.