Asset Usage Feature
Detailed breakdown of the distribution of brands, locations, and access points. Inspect the portal traffic at an specific location or at an specific access point. Select or type the MAC or name of the Access Point, location, or brand you wish to inspect in detail.
This feature you can find it on Workspace section, the first Dashboard you will see once you log in to the Aiwifi Platform.
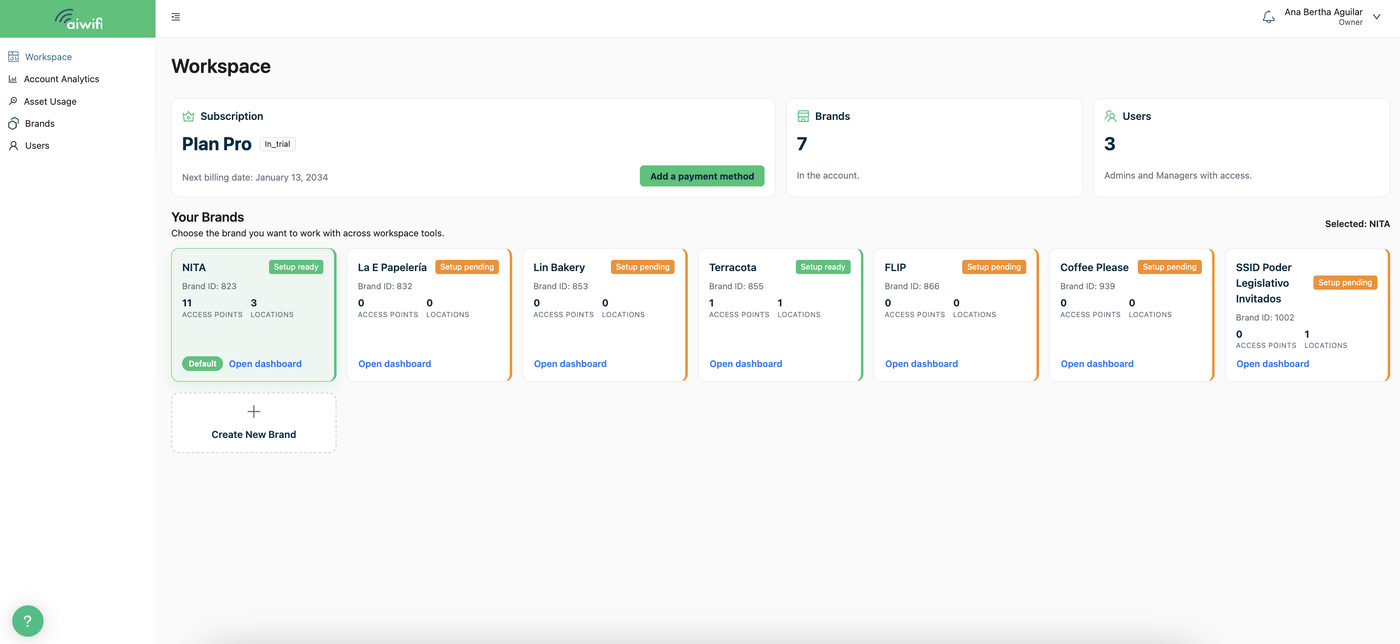
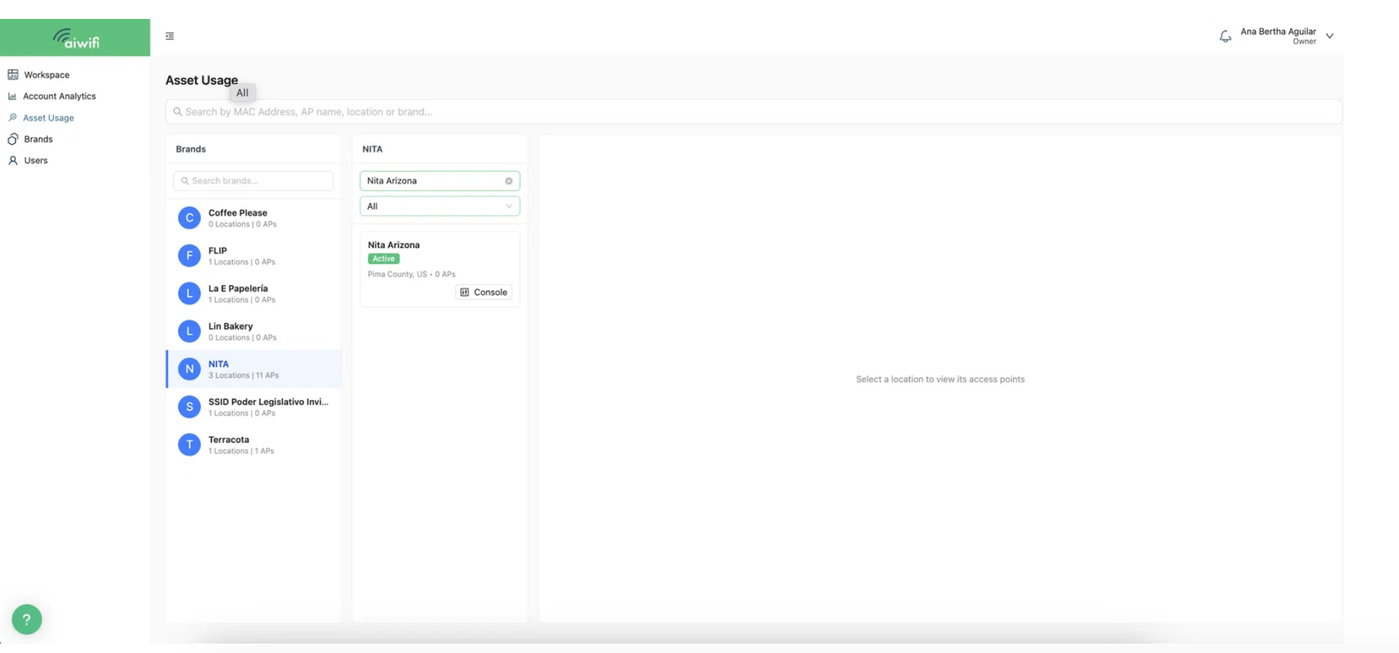
Select the Asset Usage button on the left column to see the Asset Usage Dashboard on your screen.
Here select the MAC Adress, AP Name, location or brand you want to inspect. Also you can search the brand and select the specific location, Once you do that, then click on the console button of the location selected to access .
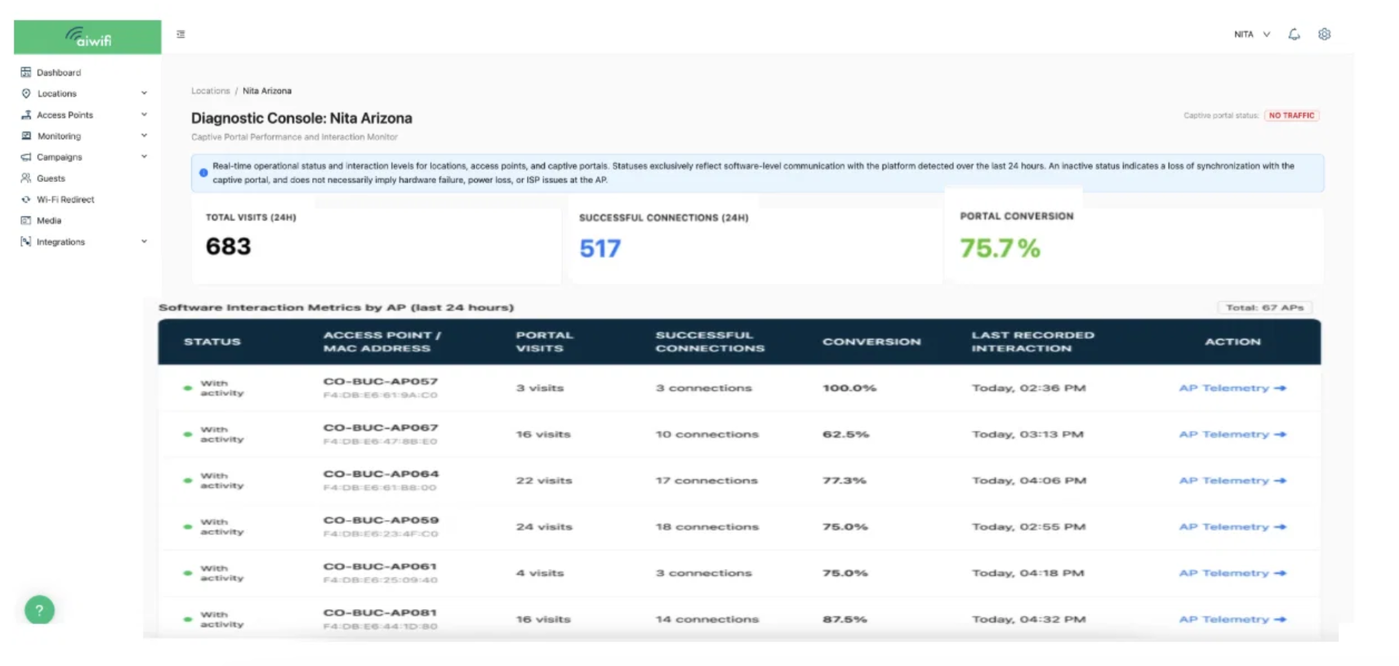
Diagnostic Console Dashboard:
Select the “Console” button to access to the Diagnostic Console dashboard. In this section, you can monitor the performance and interaction of the captive portal. View the real-time operating status of locations, access points, and campaigns or captive portals.
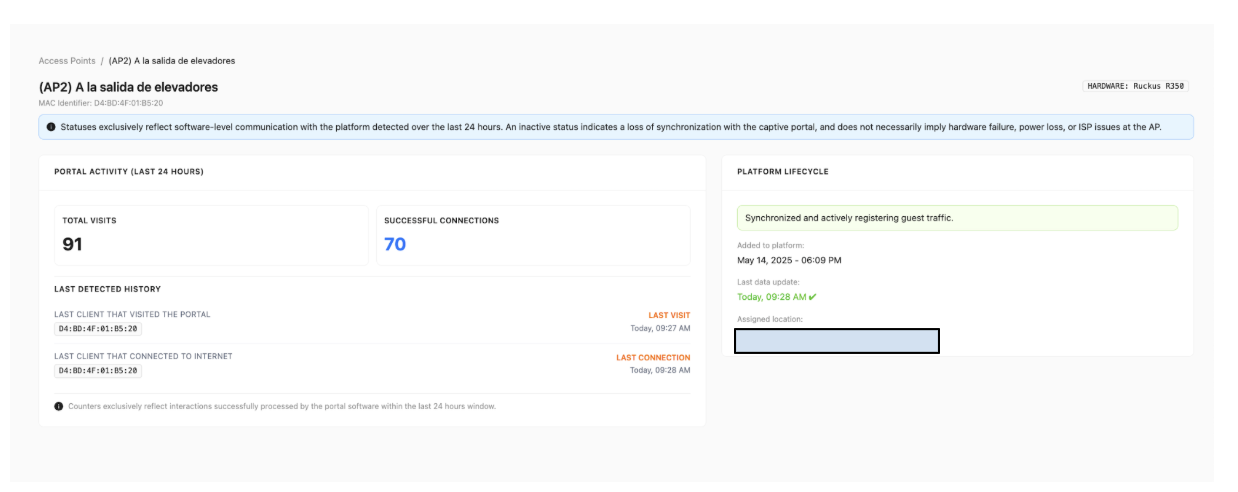
AP Telemetry:
If you want more details about each AP, you just have to select the “AP Telemetry button” you want to inspect.
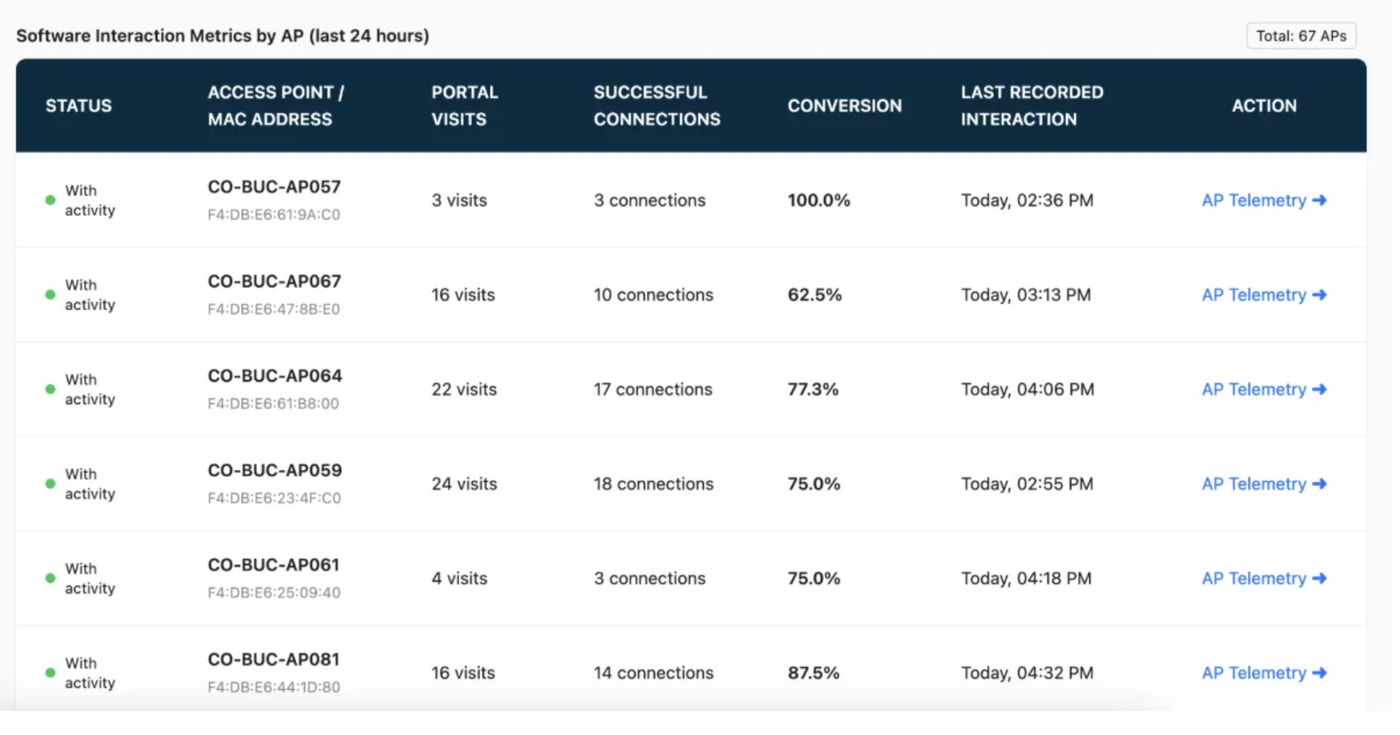
Once you select the AP Telemetry button on your screen it will deploy the follow Dashboard where you will see the statuses exclusively reflecting software-level communication with the platform detected over the last 24 hours, the total visits, the successful connections and more, here is an example: