Access Points
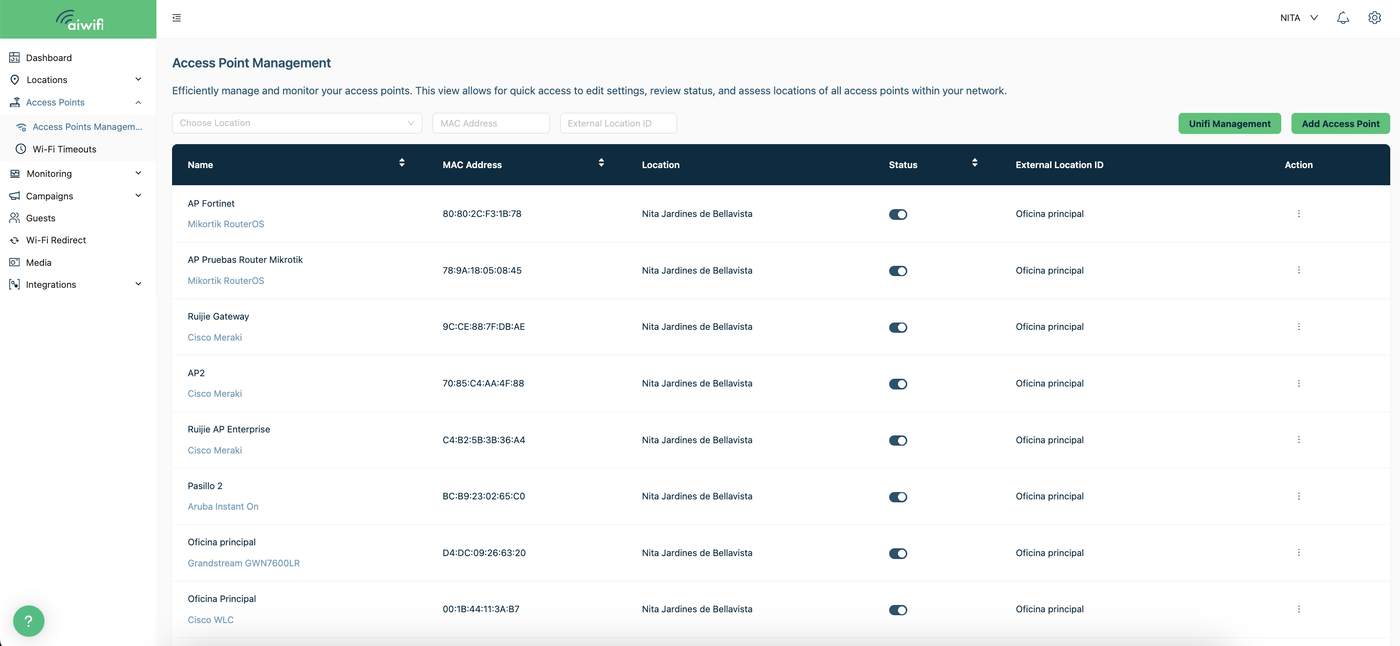
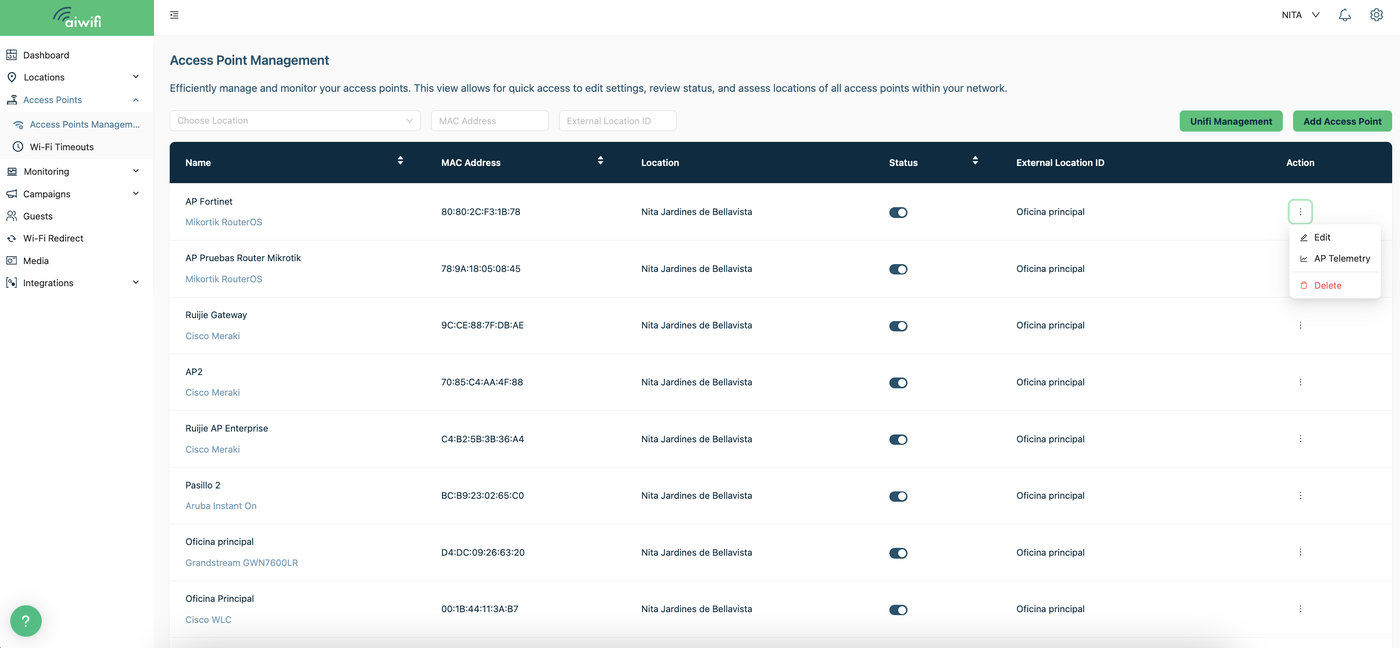
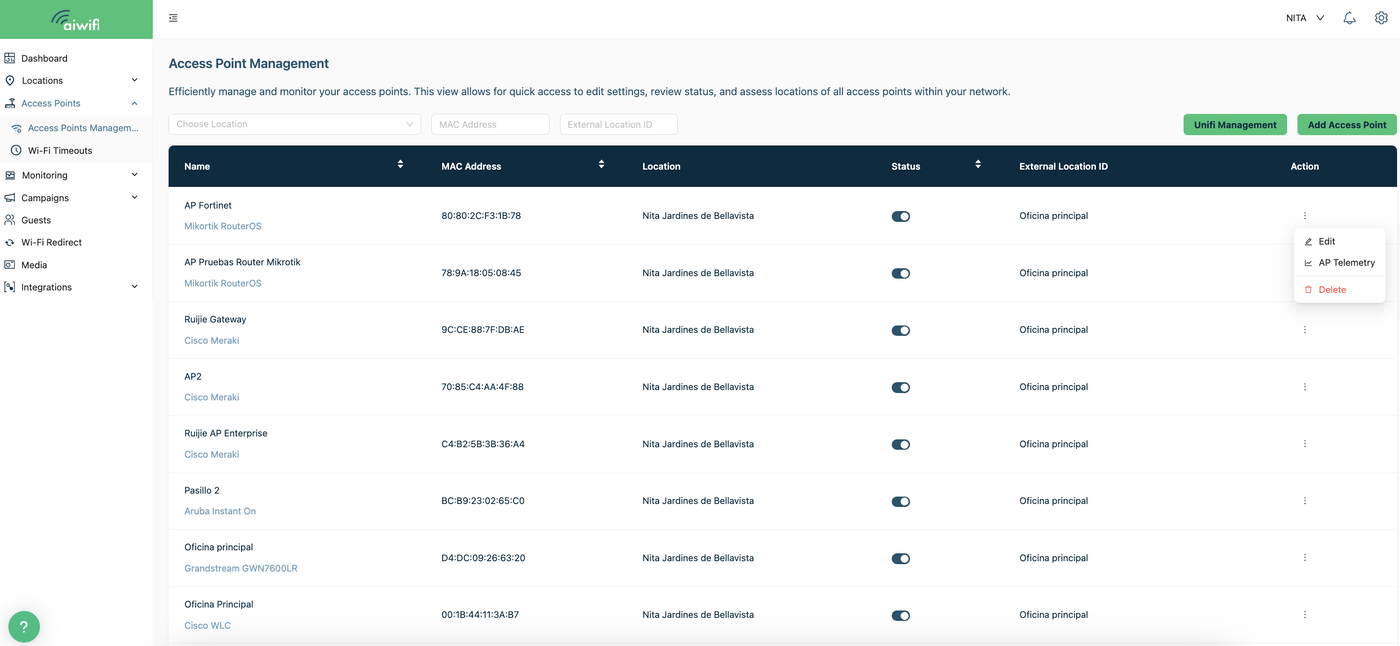
Access Point Management
Efficiently manage and monitor your access points.
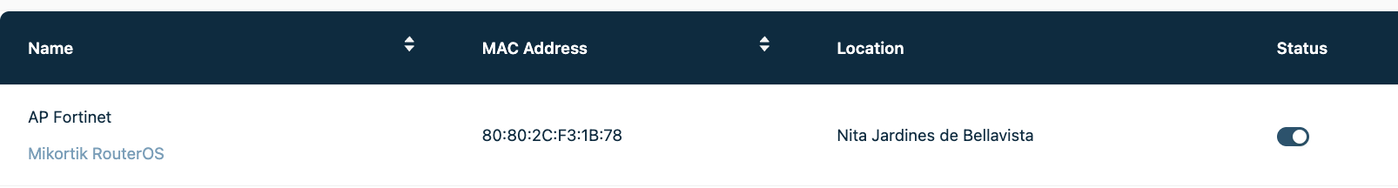
This view allows for quick access to edit settings, review status, and assess locations of all access points within your network.
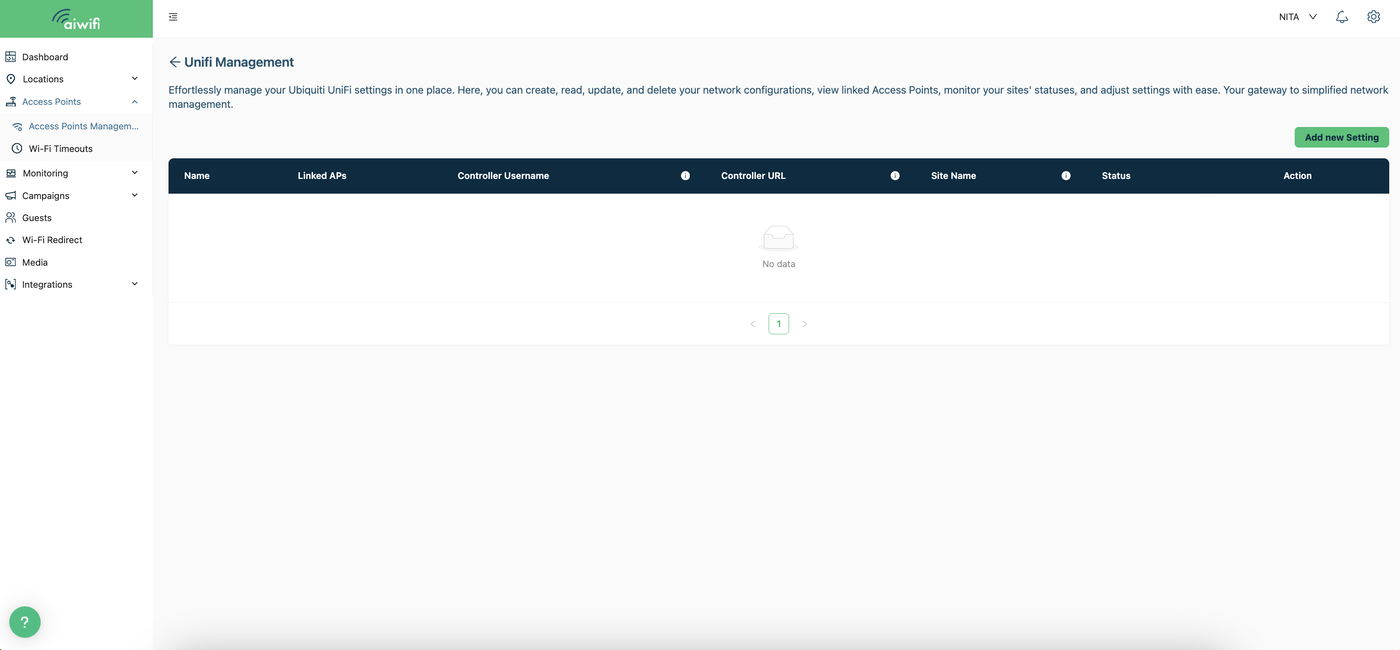
Inspect and manage your equipment (MACs, Access Points) and view their status, such as connections and visits they have had in the last 24 hours; now you can view specific details of each device.Additionally, you can effortlessly manage Ubiquiti UniFi settings in one place, monitor the status of your sites, and adjust settings with ease.
UniFi Management:
Easily create, read, update, and delete your network configurations, view linked access points, monitor the status of your sites, and adjust settings. To view your network configurations, select the “UniFi Management” button. In this dashboard, you will be able to see the network name, linked access points, controller username, controller URL, site name, etc.
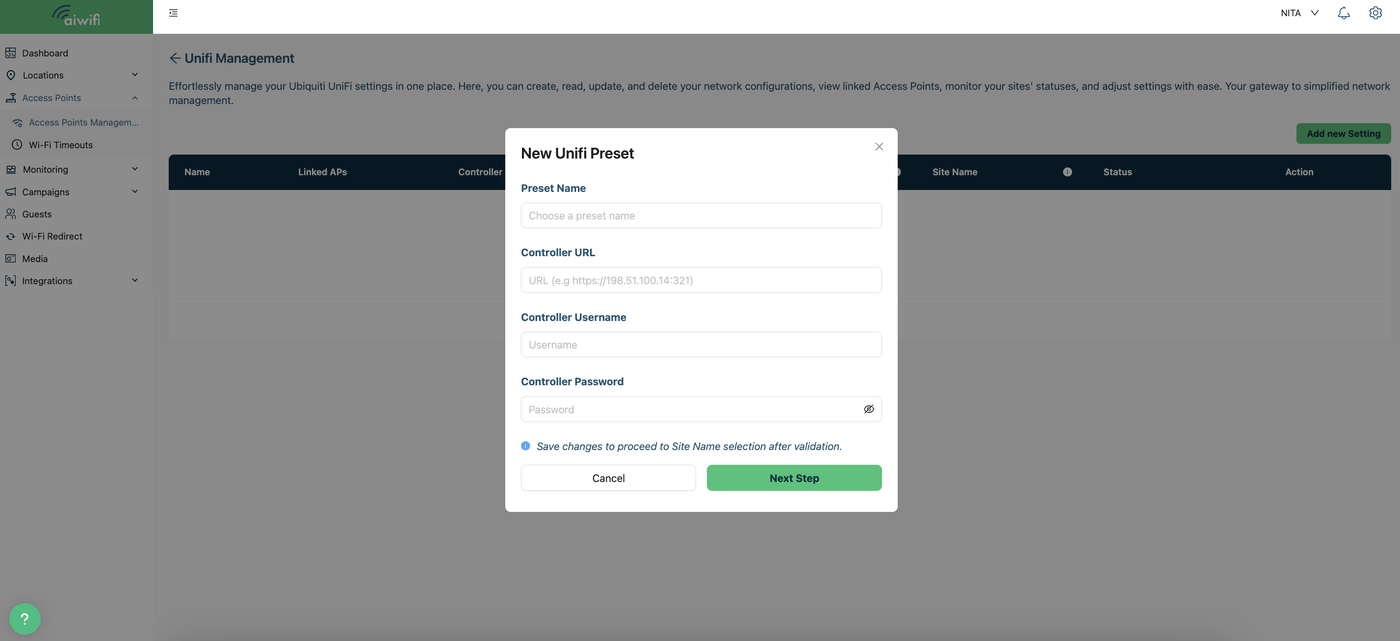
Add new setting:
To add a new setting, simply select the “Add new configuration” button. A box will appear on your screen for you to fill in the requested information.
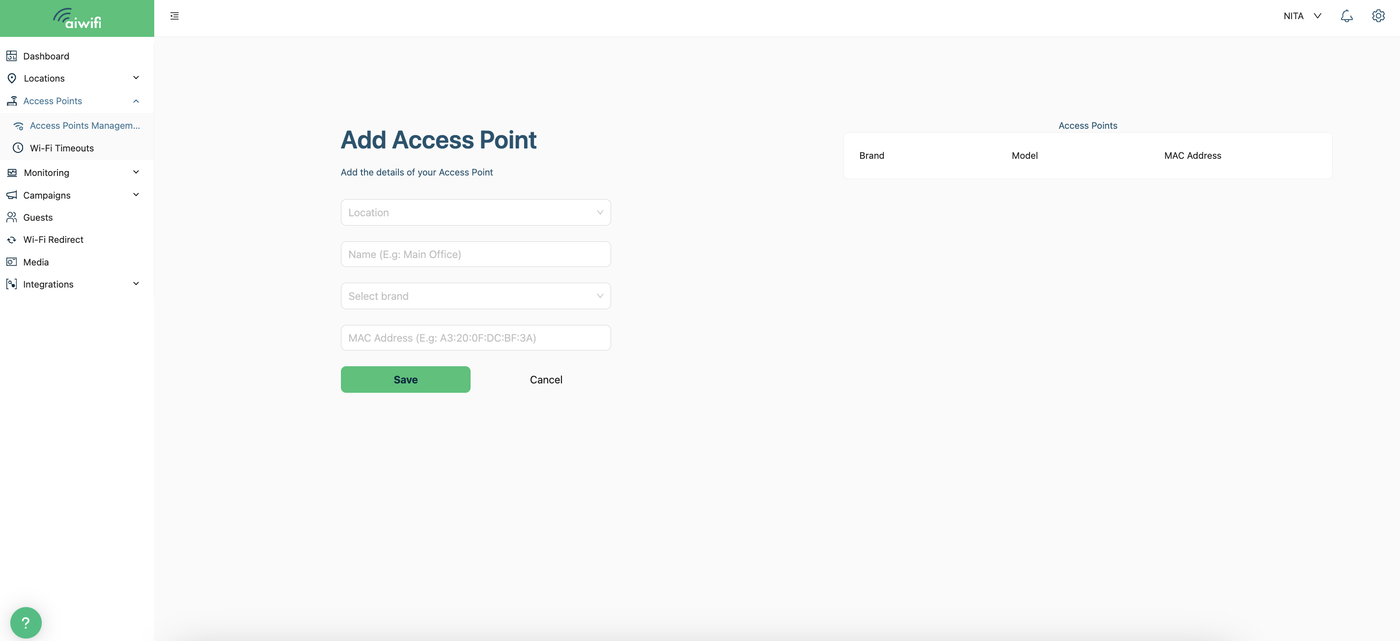
Add Access Points:
Enter your access point details, including the location where the access point will be active, a name for your internal reference, the brand, and the device's MAC address. Once you have finished, click "Save".
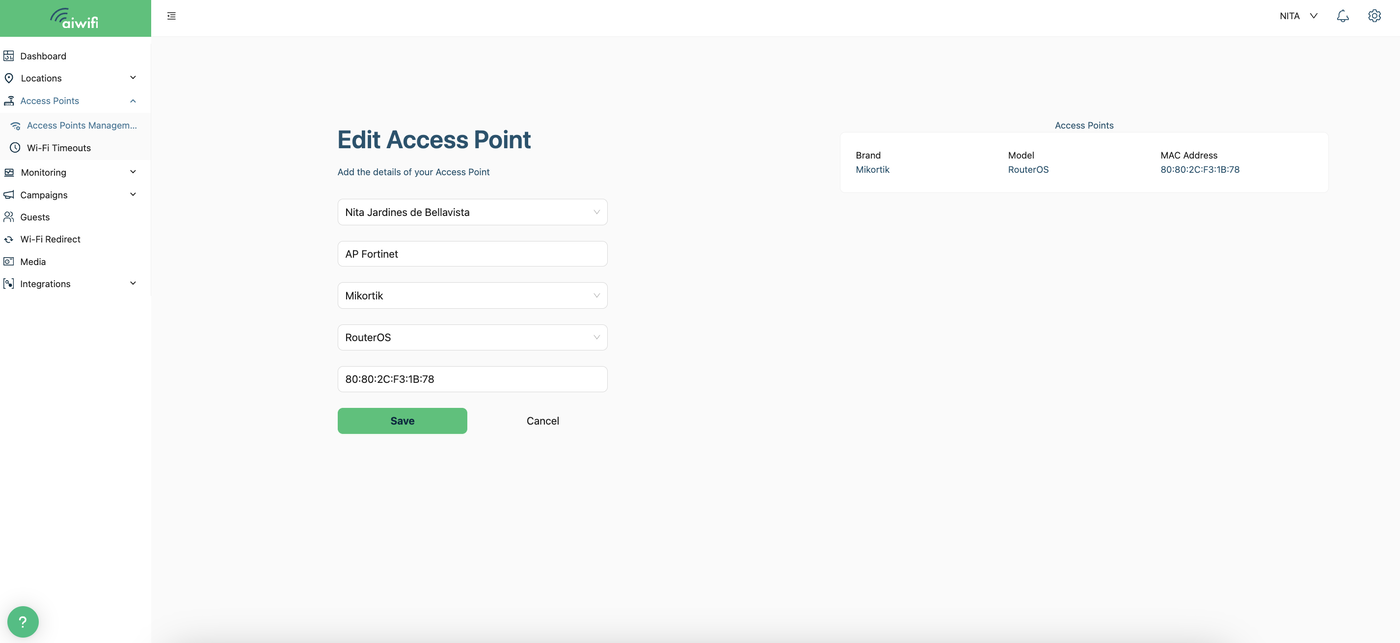
Edit an Access Point:
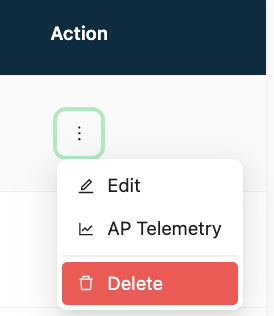
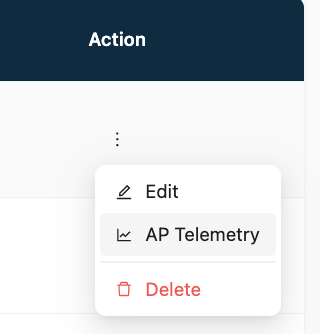
To edit an access point, simply go to the black bar on the Access Point Administration dashboard and select the three dots located under the "Action" column.
Select "Edit" and the "Edit Access Point" section will automatically appear on your screen.
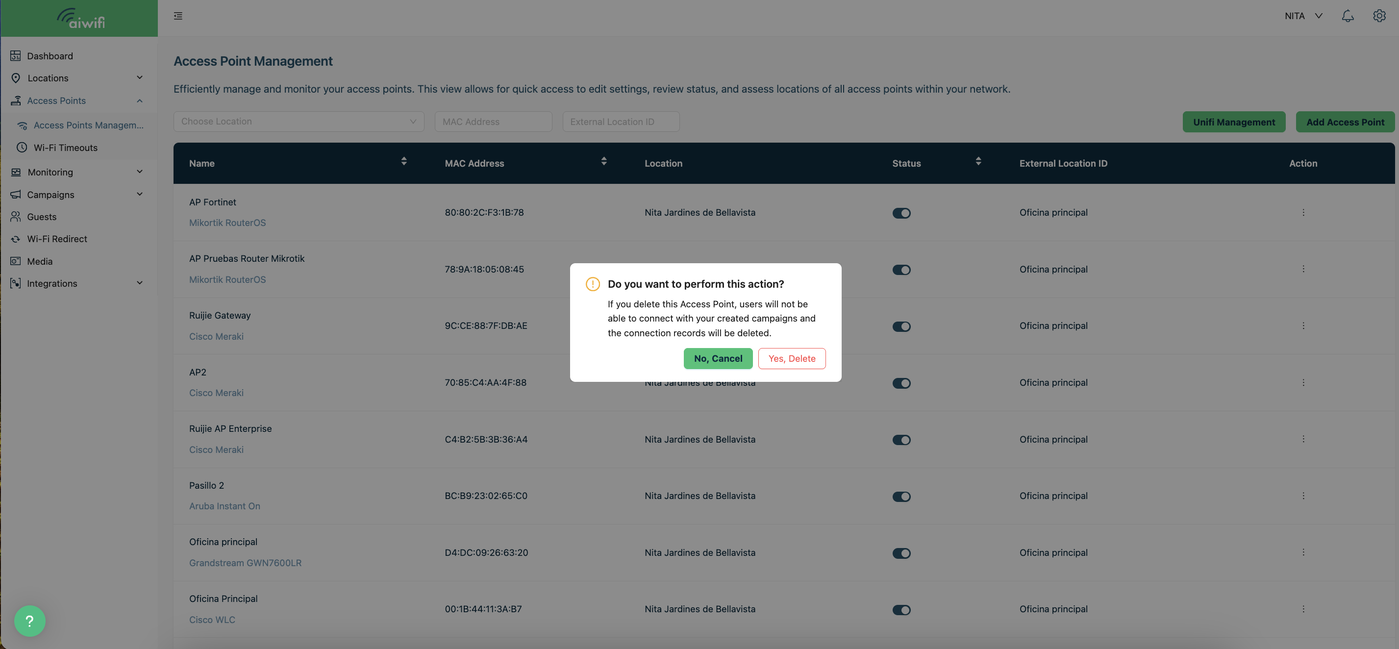
Delete an Access Point:
To delete an access point, select the three dots under the "Action" column and click "Delete".
A confirmation box will appear. Once you click "Yes, delete", the access point and its associated data will be removed.
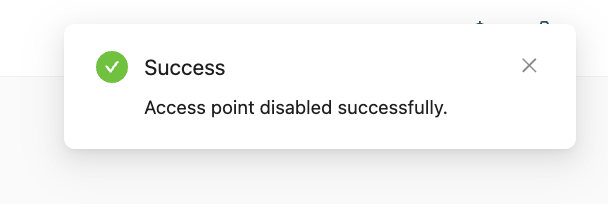
Deactivate an Access Point:
To deactivate an access point, simply go to the Access Point Administration dashboard and click the "Access Point Status" button.
Once you select the "Action" button, a box will appear on the screen confirming that the operation was successful.
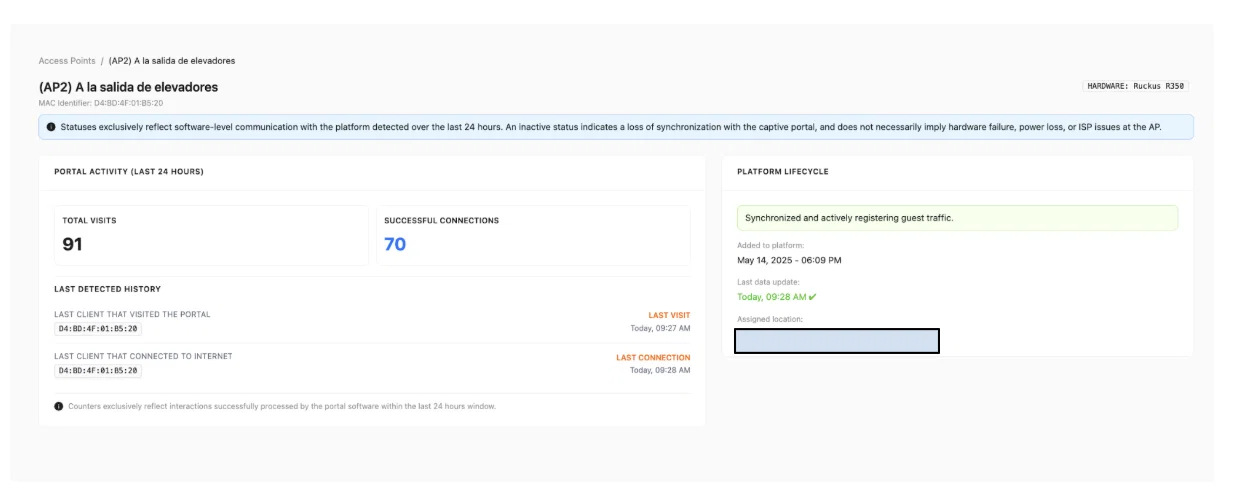
Access AP Telemetry:
To open the Access Point Telemetry dashboard, simply click the three dots under the "Action" column in the Access Point Administration menu bar.
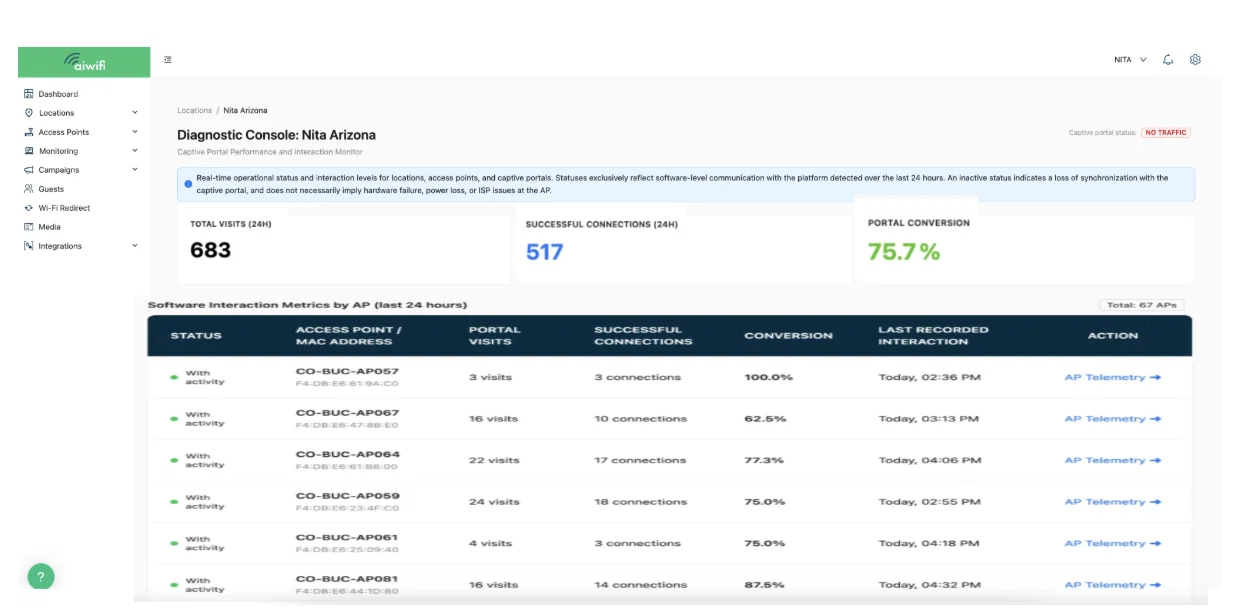
Diagnostic Console:
After selecting the "AP Telemetry" button, the diagnostic console will open on your screen. In this section, you can monitor the performance and user interaction of your captive portal. You can also see the real-time status of your locations, access points, and active campaigns or portals.
AP Telemetry:
If you want more details about each AP, you just have to select the “AP Telemetry button” you want to inspect.
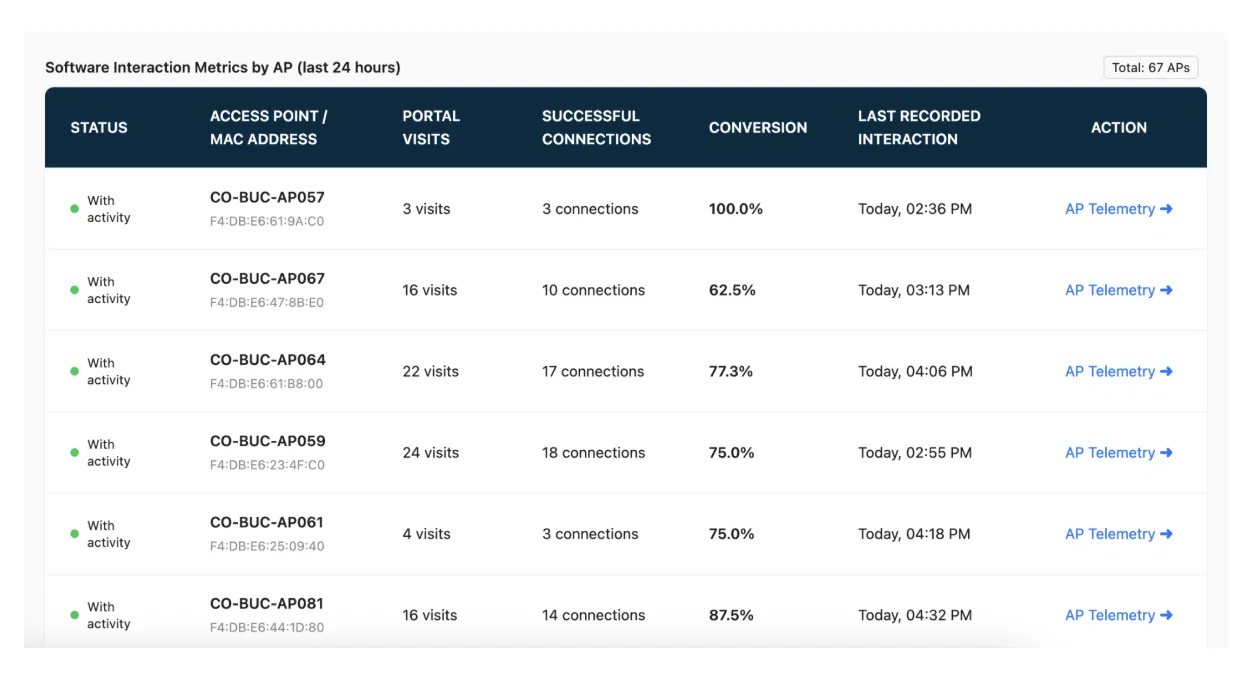
Once you select the AP Telemetry button on your screen it will deploy the follow Dashboard where you will see the statuses exclusively reflecting software-level communication with the platform detected over the last 24 hours, the total visits, the successful connections and more, here is an example: